
Initiating Coverage Report
Nippon Life India Asset | Initiating Coverage Report
Nippon Life India Asset Management Ltd.
27th July 2022
BUY
CMP Rs. 285
TARGET Rs. 411 (+44.2%)
Too much pessimism priced-in
Nippon Life India AMC (NAM) is the 6th largest Asset Management Company
in India and the 2nd largest non-bank AMC with mutual fund Asset Under
Management (AUM) of Rs. 2.83 Trn (as of 31st Mar’22), commanding a
market share of 7.4%. It also manages PMS/AIF/offshore advisory mandates,
representing 20% of its total AUM but contributing ~11% to its topline. The
Company follows the ‘Investor First’ philosophy and launches schemes to
cater to investors’ varied and diverse needs. Currently, the Company is
focused on growing its retail franchise and remaining a relevant player in the
ETF space. We initiate coverage on Nippon Life India Asset Management with
a BUY rating and a target price of Rs. 411
Company Data
| MCAP (Rs. Mn) | 1,77,049 |
|---|---|
| O/S Shares (Mn) | 623 |
| 52w High/Low | 477 / 259 |
| Face Value (in Rs.) | 10 |
| Liquidity (3M) (Rs. Mn) |
173.6 |
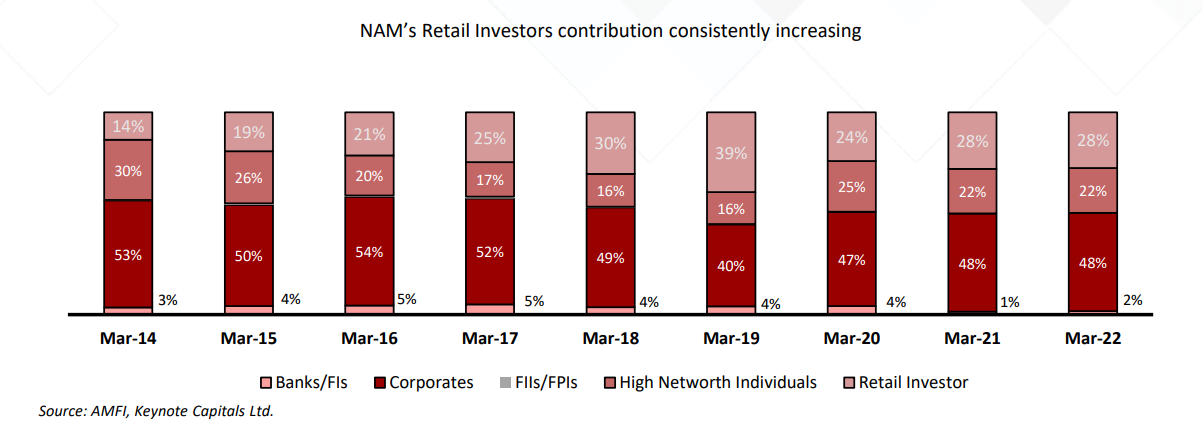
Strong retail franchise in favourable in AUM mix
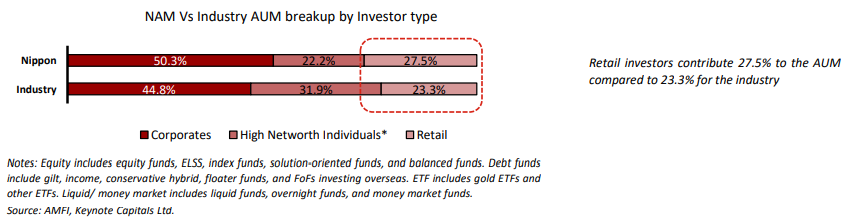
The share of retail investors in the AUM mix of NAM has increased from
13.6% in FY14 to 27.5% in FY22. A similar number for the industry is 23.3%.
Retail investors tend to be more inclined toward equity products and are
more sticky than other investor classes. A rising share of retail investors
bodes well for AMC’s AUM yield. NAM has a higher market share in the retail
segment at 8.7% vs. 7.4% overall market share.
Shareholding Pattern %
| Mar 22 | Dec 21 | Sep 21 | |
|---|---|---|---|
| Promoters | 73.8 | 73.8 | 74.0 |
| FIIs | 6.7 | 7.2 | 6.6 |
| DIIs | 8.8 | 8.4 | 8.8 |
| Non-Institutional< | 10.7 | 10.7 | 10.6 |
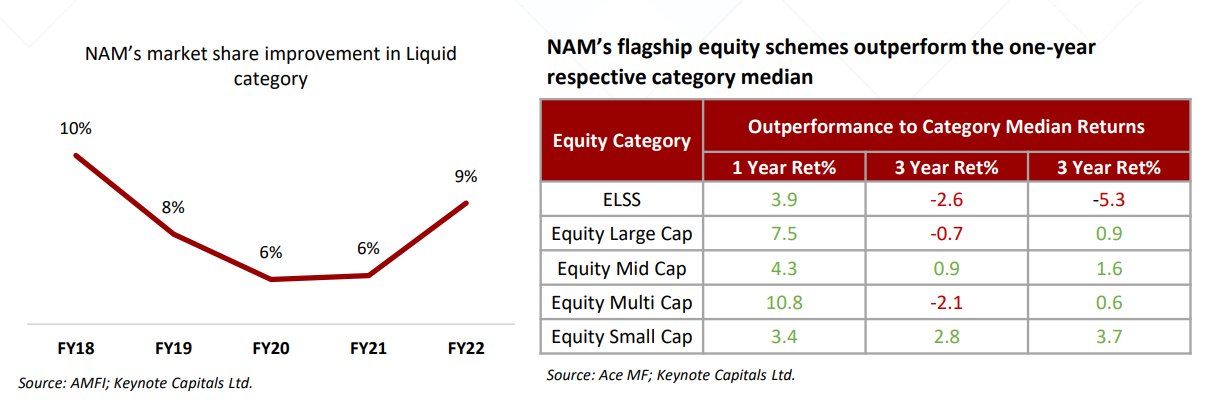
Recent equity fund performance showing encouraging sign
NAM has shown smart recovery in scheme performance. They have managed
to improve their ranking from 20/30+ rank in 3 & 5-year performance to
amongst the top performers in that category in last one year. Generally,
improvement in scheme performance is followed by market share gain.
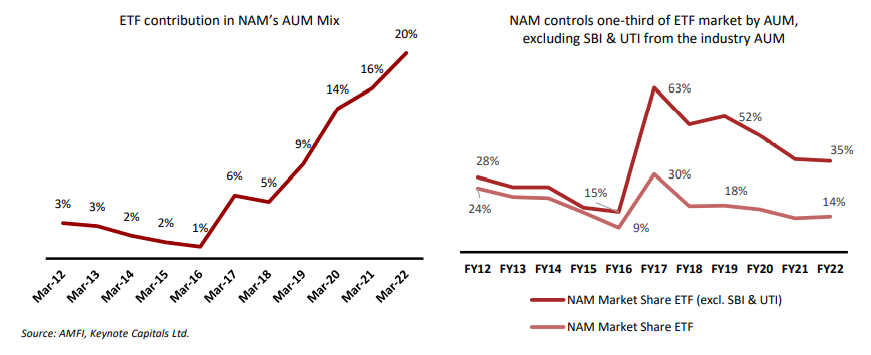
NAM continues to be a relevant player in ETF space
The company has one of the industry’s most extensive suites of passive
products, with 25-30 ETF schemes and 6 Index Funds. NAM has almost 58%
of the industry’s folio market share in the passive category. NAM’s ETF
schemes contribute ~68% of exchange ETF volumes. NAM has a 13.5%
market share of overall ETF AUM.
NAM vs Nifty
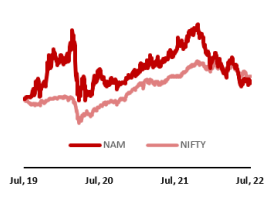
Source: Keynote Capitals Ltd.
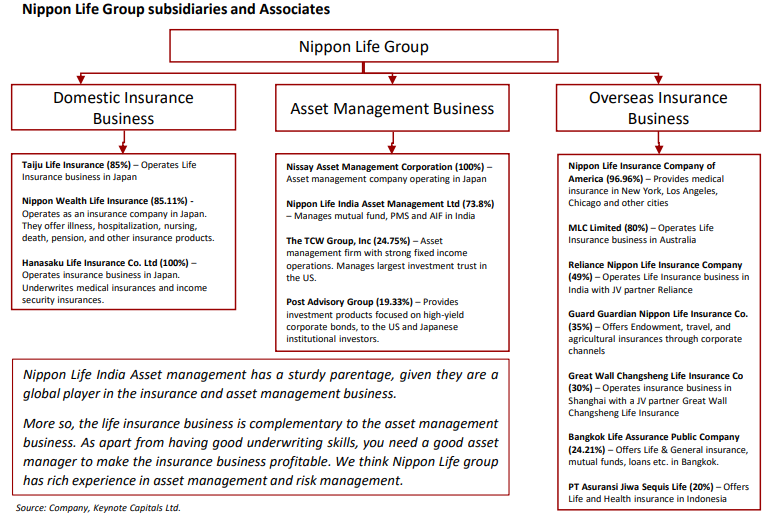
Strong parentage
Nippon Life India Asset management has a sturdy parentage, given they
have a global presence in the insurance and asset management business.
The life insurance business is complementary to the asset management
business as besides having underwriting skills, you need a good asset
manager to make the insurance business profitable. Nippon Life group has
rich experience in asset management and risk management.
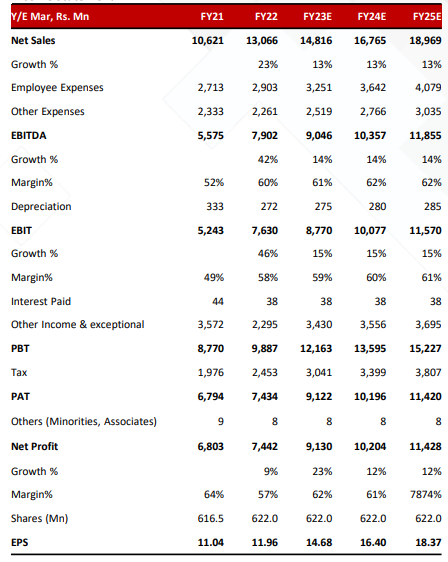
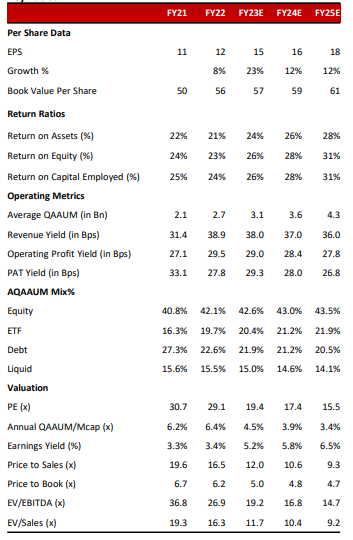
Key Financial Data
| (Rs mn) | FY22 | FY23E | FY24E |
|---|---|---|---|
| Revenue | 13,066 | 14,816 | 16,765 |
| EBITDA | 7,902 | 9,046 | 10,357 |
| Net Profit | 7,434 | 9,122 | 10,196 |
| Total Assets | 37,965 | 39,200 | 40,336 |
| ROCE (%) | 24% | 26% | 28% |
| ROE (%) | 23% | 26% | 28% |
Source: Company, Keynote Capitals Ltd.
View & Valuation
We initiate coverage on Nippon Life India Asset Management with a BUY
rating and a target of Rs. 411 (28x FY23 earnings). Since erstwhile promoter
Reliance Capital defaulted, the company’s growth has underperformed the
industry, but with the enhancement in market share in the last few quarters
and a massive improvement in scheme performance, we expect NAM to grow
at least in line with the industry going ahead. Given that NAM is trading at – 1
standard deviation of its trailing PE, chances of Re-rating are High, and the
downside from current levels seems limited.
Research Analyst
chirag@keynotecapitals.net

Nippon Life India Asset | Initiating Coverage Report
Industry Overview
In 1963, the Indian mutual fund industry commenced operations with the
formation of the Unit trust of India (“UTI”) by an Act of Parliament. UTI
remained the only player in the mutual fund industry for over twenty-five
years, and its AUM increased from Rs. 250 million in 1965 to Rs. 67 Bn in
1988. In 1993, the mutual fund industry was opened for private players.
Many Banks and foreign mutual fund houses participated in the industry. By
the end of February 2003, there were 33 AMCs with total assets of Rs. 1.22
Trn. Since then, the industry has grown at a CAGR of 19.6% (Upto March
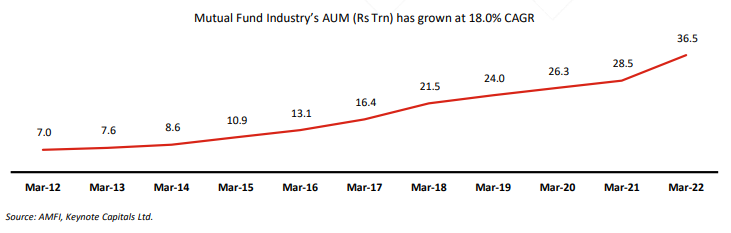
2022). Over the last decade, the mutual fund industry has maintained its
growth rate and has increased at an 18.0% CAGR from Rs. 7 Trn in FY12 to
Rs. 36.5 Trn in FY22.
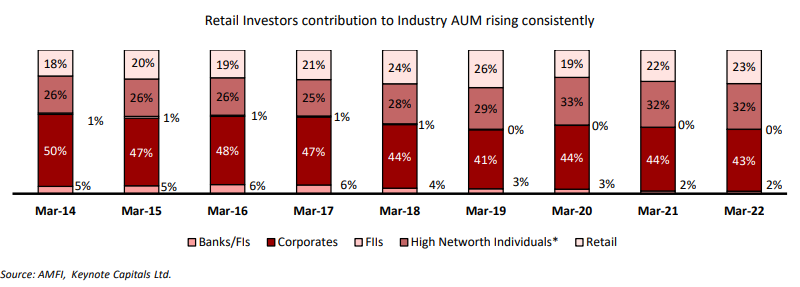
Retail Investors are contributing to the growth…
The industry’s investor base can be broadly categorized as Retail, High Net
worth Individuals (HNI), and Institutional Investors. Participation from retail
investors increased from 18.1% in Mar 2014 to 23.3% in Mar 2022. Retail
and institutional investors tend to have a higher contribution towards
equity.
Increasing equity mix bodes well for AMCs…
Equity AUM as the proportion of total industry AUM rose from 29.8% in
March 2012 to 48.6% in Mar 2022, which can be attributed to increasing
awareness, financialization of savings, rise in SIPs, etc. Even increasing
contribution from retail investors (who have a high inclination towards
equities) has contributed to a surge in equity AUM in the overall mix.
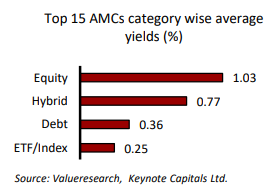
Increasing equity mix bodes well for the AMCs since they get better yield
compared to debt/liquid/passive products.
Nippon Life India Asset | Initiating Coverage Report
Rising Mix of Equity and ETFs in Industry AUM
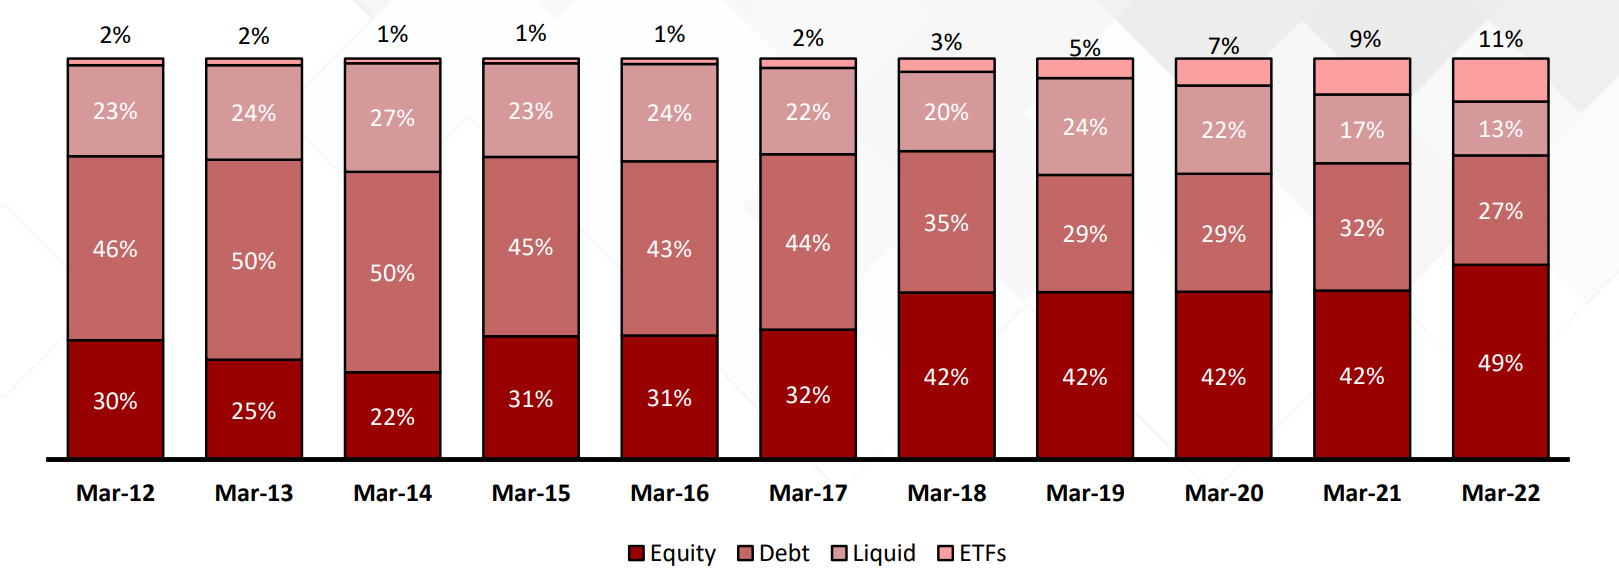
EPFO contributing to the growth of passive products…
With rising awareness and preference for passive funds, the contribution of
ETFs has also increased tremendously from 1.7% in March 2012 to 10.8% in
Mar 2022. Since Mar 2012, ETFs have posted the highest growth, with assets
swelling at 43.7% CAGR (on a low base). Institutional investors such as
Employee’s Provident Fund Organization (EPFO) began investing a portfolio
(currently 15%) of their fresh accretion/incremental deposits into equities via
passively managed funds. Of the ETF AUM, the majority is contributed by
corporates (~90% as of Mar 2022), whereas retail & HNI combined contribute
~10% of the AUM (Mar 2022).
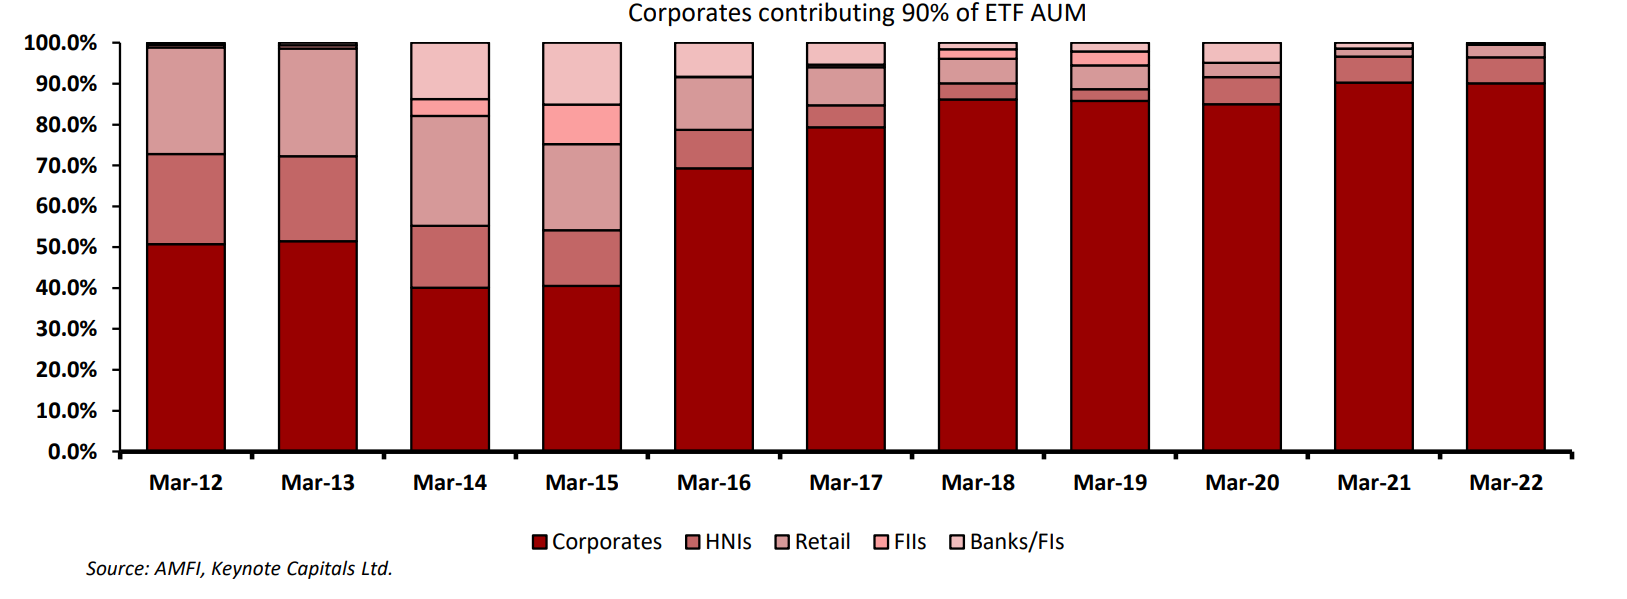
SBI and UTI are the major AMCs in passive funds, driven by high ticket
mandates from public sector funds to manage investments in passive funds.
In the previous year, ETF AUM from retail has grown 2.4x owing to discounts
provided via government disinvestment schemes (CPSE ETF and Bharat 22),
aimed at increasing retail investor participation.
Nippon Life India Asset | Initiating Coverage Report
The expense ratio of passive ETFs and index funds is lower than actively
managed funds, and increasing the contribution of passive products in the
overall AUM mix can dent yields for AMCs. Though passive AUM may grow at
a faster pace compared to other categories, the revenue contribution of
passive products in AMC’s overall revenue mix will remain the same.
The Indian mutual fund industry has 45 AMCs comprising bank-sponsored
and private AMCs. Despite this, the industry continues to remain
consolidated, with the top 10 AMCs accounting for more than 80% of
industry AUM. Bank-sponsored AMCs continue to gain market share on the
back of the better distribution network of their parent.
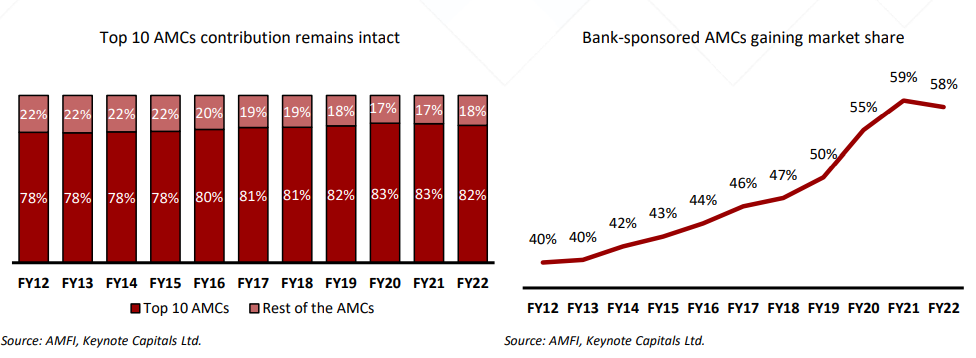
Top 10 AMCs’ growth (18.6%) has been in line with the industry (18.0%) in the
last ten years.
Bank-sponsored AMCs have grown at a much faster pace of 22.4% since Mar-2012,
increasing their market share from 40% in FY12 to 58% in FY22
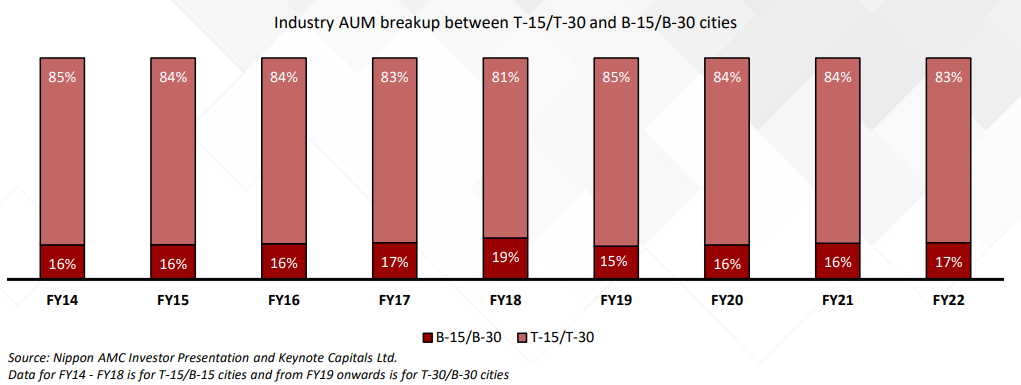
B-30 cities to be the next growth driver for AMCs, and bank-sponsored
AMCs have the upper hand…
Historically, AUM has been concentrated in the Top 30 (T-30) cities due to the
presence of institutional investors, and they have a high concentration of
assets in non-equity schemes. The T-30 cities hold the majority of mutual fund
assets with a share of 83.4%, whereas Beyond 30 (B-30), cities held 16.6% of
assets as of 31st March 2022. AUM from B-30 has a higher equity asset
composition than T-30 cities. Further, B-30 cities are gaining significance in the
industry AUM mix as the SEBI provides impetus to mutual fund penetration in
B-30 cities by allowing additional Total Expense Ratio (TER). Most investors
from B-30 tend to be individual investors with high exposure to equity via SIPs.
Given the higher concentration of retail investors in equity products, increased
B-30 market penetration should further increase the overall proportion of
equity AUM in the aggregate industry AUMs. AMCs with a higher share in B-30
cities are less susceptible to overall margin pressure than their T-30-focused
peers.
Gaining market share in B-30 cities is more manageable for those AMCs with
better brand recall among retail investors. Banks tend to have the upper hand
over non-bank-sponsored AMCs.
Nippon Life India Asset | Initiating Coverage Report
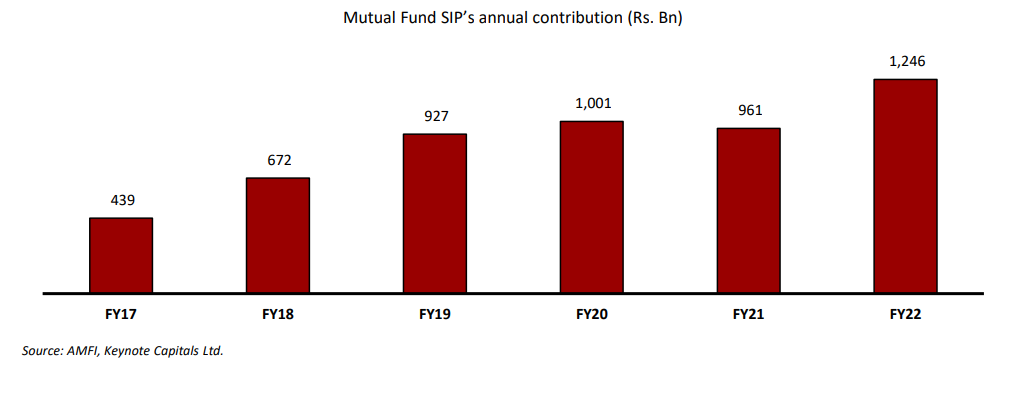
SIPs bringing sustainability to inflows
SIPs have helped further helped to increase retail investors participation in the
mutual fund space. A significant benefit of SIP is avoidance of behavioral
weakness during uncertain periods as it helps in Rupee Cost Averaging and
invest in a disciplined manner without worrying about market’s volatility and
timing the market. It is one of the strong pillars of the industry and provides
long-term sustainable inflows. It also inculcates a ‘savings habit’ among
investors and ensures a steady, disciplined approach to investing rather than
ad-hoc. SIPs have increased accessibility to lower-income households.
SIPs are far more profitable due to inflows’ stability and have a high inclination
towards equities.
Mutual Fund SIP’s annual contribution has increased by 2.8x from Rs. 439 Bn
in FY17 to Rs. 1.25 Trn in FY22.
The popularity of equity funds, rising participation of investors, recent investor
education initiatives, and apparent benefits of SIPs to households that
traditionally did not invest in mutual funds indicate that growth in inflows
from SIPs will accelerate over the foreseeable future. This would make SIPs an
increasingly important component in overall AUM growth.
Nippon Life India Asset | Initiating Coverage Report
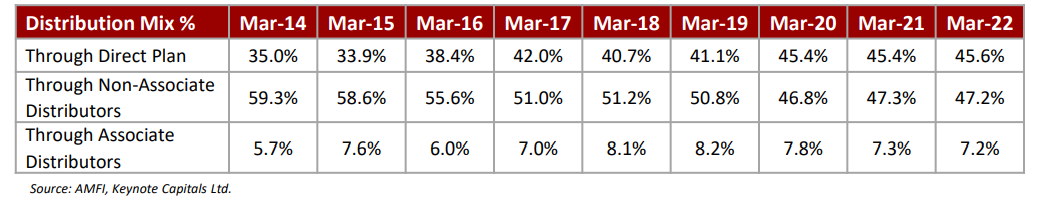
Direct channel sourcing is gaining prominence…
Direct channel’s contribution of MF assets stood at 45.6% as of March 2022.
Most of the debt AUM is invested via a direct channel as it is the preferred
route by institutional investors. Digitalization and increased adoption of
fintech apps like Zerodha coin, Paytm money, etc., which has made investing
in direct mutual funds an easy process, and increased awareness between
regular and direct plans led to the rise in direct mutual funds. As more and
more investors prefer to Do it Yourself (DIY) compared to advisory
professionals, we believe, this new set of DIY investors will unduly give more
weight to past returns, known brands, and the Total Expense Ratio (TER) of the
fund. The probability of them abandoning will be very high during a short
period of underperformance as no professional guides them through their
investment journey. Given the pickup in DIY trend, AMCs will have to educate
investors during extreme volatility. Hence, AMCs in the future, managing to do
that efficiently might lead in retail participation.
Over the last decade, there has been a gradual increase in net financial
savings, and its share in the overall household savings in India has stabilized
with an upward bias. Also, the share of mutual fund assets in gross financial
household assets in India rose in the last few years.
Although India’s mutual fund penetration (AUM to GDP) rose to 12.1%, it is
still much lower than the world average of 63%. It is also lower than many
developed economies such as the United States (120%), Canada (81%), France
(80%), and the UK (67%), and emerging economies such as Brazil (68%) and
South Africa (48%).
As India advances, favorable demographic, formalization of the economy,
growing financial inclusion, higher disposable income, and investable surplus,
increasing financial savings, higher investor awareness, investor-friendly
regulations, a wide range of transparent and investor-friendly products, ease
of investing, tax incentives, expanding distribution coverage, digitalization, and
perception of mutual funds as long-term wealth creators, are expected to be
key drivers for the growth of the Mutual Fund industry.
Nippon Life India Asset | Initiating Coverage Report
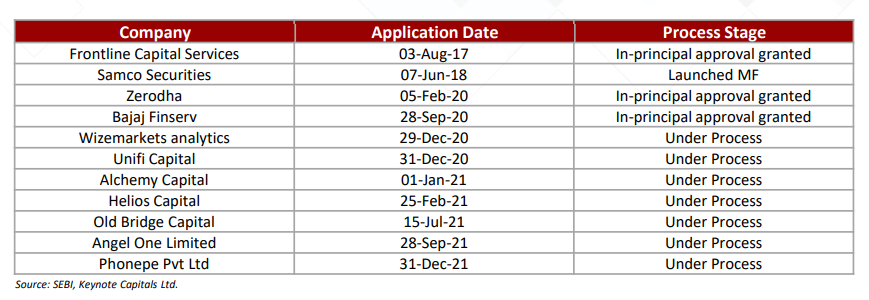
Competition Intensifying
SEBI’s recent relaxation of the AMC license issuance norm has paved the way
for many new AMCs applying for licenses. The new norms have eliminated
profitability as a criterion as long as companies obtain new licenses and
maintain Rs. 1 Bn in capital until they become profitable in five years.
Many new fintech companies like Zerodha, Phonepe, etc., have also applied
for the license. We expect their offering to be more focused towards passive
or rule-based offerings.
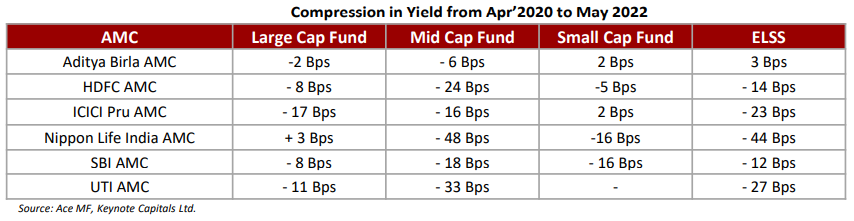
AMC’s revenue yield under pressure
Most of the listed AMCs have stated pressure on their revenue yields in the
last one year owing to multiple reasons:
• Due to the inverted pricing structure, a rise in AUM leads to lower TER
• Rising competition among AMCs getting into AUM gathering rather than
focusing on profitable growth has resulted in pricing indiscipline. Many
new NFOs are being priced at higher commissions, and AMCs are getting
lower yields. For example, in May 2021, Aditya Birla launched its Multi Cap
fund (Aditya Birla Multi Cap Fund) with a total expense ratio of 2.12% for
the regular scheme and 0.19% for the direct scheme. They are paying
1.93% commission to distributors against ~1% being the industry trend.
• Old assets with higher yields are getting replaced by newer assets with
lower yield.
• Passive funds are the fastest growing category that carries the lowest
yields for the AMCs.
Hence, yields for AMCs are likely to remain under pressure for the
foreseeable future.
Nippon Life India Asset | Initiating Coverage Report
Major regulatory changes in the industry
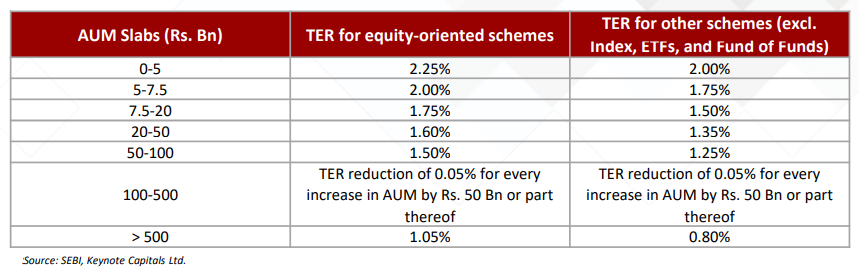
Capping on Total Expense Ratio (TER) from 1
st April 2019
From 1st Apr’19, TER has been capped based on fund size.
Revised Total Expense Ratio for open-ended schemes:
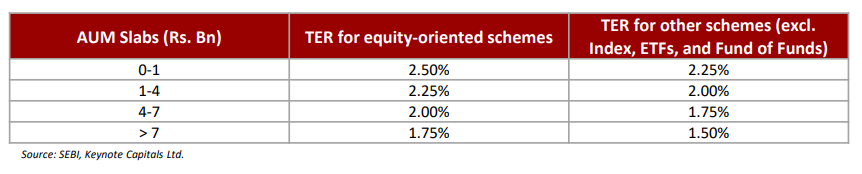
Prior Total Expense Ratio:
Reclassification of Mutual Fund Schemes
SEBI classified all open-ended schemes under five groups:
a. Equity
b. Debt
c. Hybrid
d. Solution Oriented; and
e. Others (Index, ETFs, FoFs)
For equity funds, ten categories are specified (based on market cap
orientation and investment style), 16 for debt funds (by portfolio duration,
type of securities, and credit risk), 6 for hybrid funds (by asset mix), and two
each for solution-oriented and other fund groups. Only one scheme per
category is permitted. However, Index funds, ETFs, FoFs, and sectoral or
thematic funds were exempted from the one product per category limit. So
each AMC can have a maximum of 34 schemes apart from passive, sectoral,
and thematic funds.
Discontinuation of upfront commission to distributors
SEBI banned upfront commission in mutual funds to stop the practice of
unnecessary churning in mutual fund portfolio, especially in B-30 cities. The
upfront commission is a one-time payment that an AMC pays a distributor on
selling a mutual fund scheme to an investor. Trail commission, on the other
hand, is a recurring fee paid to a distributor until the investment is
withdrawn. Trailing commission is calculated on a yearly basis and settled
every month.
Nippon Life India Asset | Initiating Coverage Report
Additional TER of upto 30 Bps for penetration in B-30 cities
SEBI permitted additional TER up to 30 bps on daily net assets of the scheme
based on inflows from B-30 cities subject to certain minimum inflows. Please
note that this additional TER can be charged based on inflows from retail
investors from B-30 cities. Thus, inflows from corporates and institutions
from B-30 cities would not attract the additional 30 bps TER.
Improving penetration beyond the top cities requires establishing more
branch networks and empanel distributors. Prior to this, AUM growth in B-30
cities does not compensate for additional operational costs. With additional
TER, the market regulator tried to incentive the same.
Scheme related expenses will not be charged on AMC books
All the scheme-related expenses which were borne by AMCs out of their
pocket earlier have to be shifted to the scheme now. Hence, the difference in
TER of the regular and direct plans will be the commission paid to
distributors.
Nippon Life India Asset | Initiating Coverage Report
Company Background
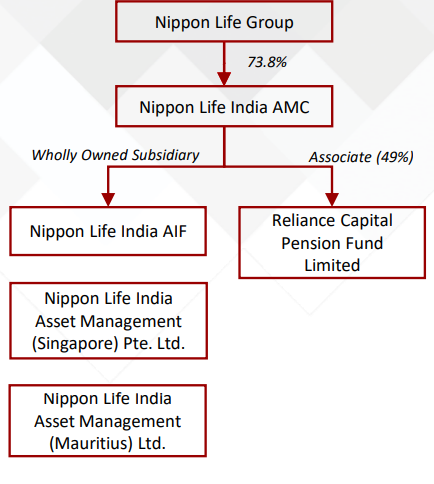
Nippon Life India Asset Management (NAM) is a subsidiary of Nippon Life
Insurance Company (NLI) which currently holds 73.8% of its outstanding
shares. NLI, a fortune 500 Company, is one of the largest life insurers in the
world, managing assets of over USD 700 Bn. NLI has an extensive global
network with a presence across the US, Europe, Asia, and Australia, a 130-year
track record in the Life Insurance business, and global investments across
Asset Management companies.
Nippon Life India AMC is the 6th largest AMC in India and the 2nd largest non-bank AMC with mutual fund Asset Under Management of Rs. 2.83 Trn (as of
31st Mar’22), commanding a market share of 7.4%.
The company is primarily involved in managing:
1. Mutual Fund, including exchange-traded funds (ETFs)
2. Managed accounts, which include Portfolio Management Services (PMS),
Alternate Investment Funds (AIFs), and Pension funds
3. Offshore funds and advisory mandates.
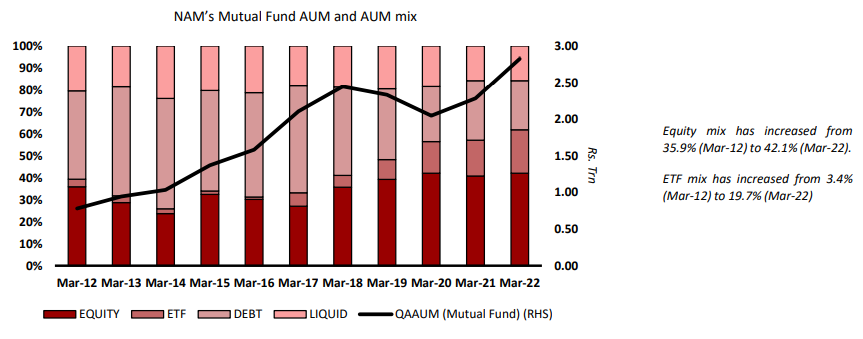
Mutual Fund business (80% of overall AUM)
Nippon Life India Mutual Fund manages 122 schemes and has a Quarterly
Average AUM of Rs. 2.83 Trn as on 31st March 2022. In the last decade, its
AUM has grown at a CAGR of 9.2%
AUM mix for the company is summarized below:
Nippon Life India Asset | Initiating Coverage Report
NAM remains among the leaders in the ‘Beyond Top 30 cities’ segment or B-30
locations. B-30 locations have a higher share of equity assets. This segment
contributed an AUM of Rs. 478 Bn, of which 76% were equity assets. 17% of its
total assets are sourced from B-30 cities, higher than the industry average.
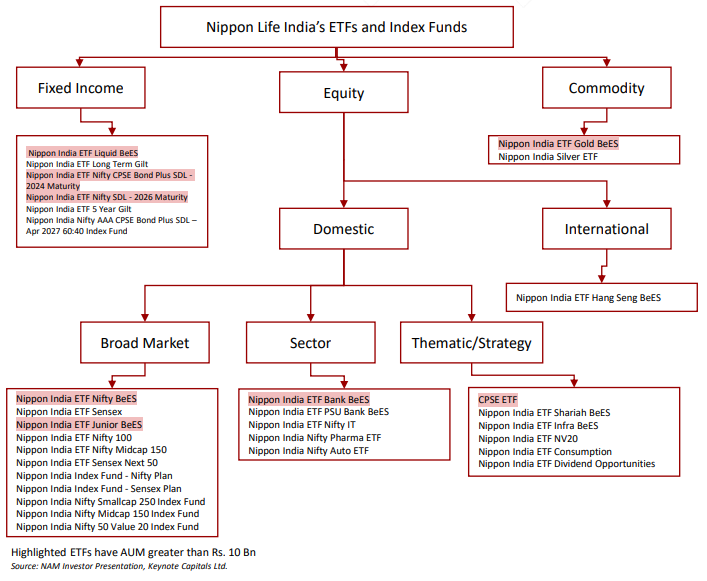
NAM has a dominant market share (14%) of the ETF market with assets of Rs.
557 Bn as of 31st March 2022. The company has a product basket of 25-30 ETF
schemes and 6 Index Funds. NAM’s ETF schemes contribute ~68% of the ETF
exchange volumes. When choosing an ETF, the liquidity of an ETF plays a pivot
role in deciding the ETF since the impact cost of acquisition is reduced
substantially. NAM is comfortably placed in ETF space.
Nippon Life India Passive Product Basket
Nippon Life India Asset | Initiating Coverage Report
Managed Accounts (17% of overall AUM)
In addition to MFs, AMC also offers Portfolio Management Services (PMS),
Alternative Investment Funds (AIF), and offshore management/advisory
services to investors as alternate investments. These services usually generate
higher yields and create additional revenue opportunity for the company.
Alternate Investment Funds:
NAM manages 16 Alternative Investment Funds (AIFs) schemes across
Category II and Category III via its subsidiary, Nippon Life India AIF
Management Limited (NIAIF). NIAIF offers various strategies under Listed
Equity, High Yield Real Estate Debt, Credit, and Tech / VC FoF, which are
privately pooled investment vehicles registered with SEBI.
The total commitments raised across all schemes is Rs. 4.4 Bn as of March 31,
2022.
Portfolio Management Service (PMS):
NAM offers four equity strategies to its investors. As of March 31, 2022, the
Company’s total AUM is Rs. 550 Bn. The company also manages two
prestigious government mandates, i.e., Postal Life Insurance and Rural Postal
Life Insurance.
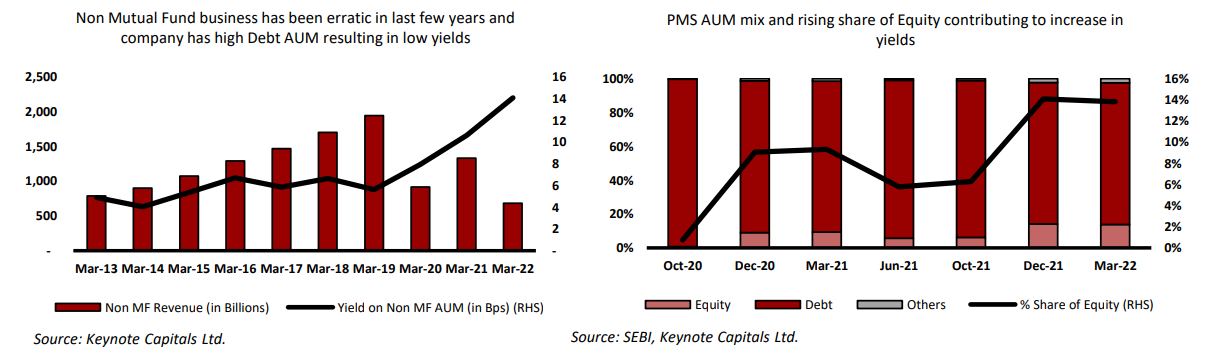
Generally, for AMCs, PMS and AIF products are yield accretive as they earn a
much higher yield than mutual funds. But as per SEBI monthly disclosure,
~85% of PMS AUM of Nippon Life India AMC is in the non-Discretionary debt
segment. Hence, AMC is not getting much benefit from a higher yield in PMS
products. They are currently earning a yield of ~10-15 bps from PMS products.
But the share of equity mix in PMS has been rising, which has increased from
0.7% in Oct 2020 to 13.8% in Mar-22, which has contributed to a steady
increase in yields from 8 bps in Mar-2020 to 14 bps in Mar 2022.
Offshore funds and advisory mandates (2.5% of overall AUM)
The Company manages offshore funds & distribution through its subsidiaries in
Singapore and Mauritius and has a representative office in Dubai. The overseas
subsidiaries help to cater to institutional and HNIs across Asia, Australia, the
Middle East, the UK, the US, and Europe.
As of March 31, 2022, the company had a total AUM of Rs. 87.6 Bn as part of
its international offshore managed portfolio. The Company also acts as an
Investment Advisor for India-focused equity and fixed income funds in Japan
and a Nifty 50 ETF in Australia.
Nippon Life India Asset | Initiating Coverage Report
Further, as of March 31, 2022, the Company had a total AUM of Rs. 26.8 Bn as
international advisory mandates. NAM India, in collaboration with BBL Asset
Management Company Ltd., an affiliated company of Bangkok Bank (BBL), the
largest Thai Commercial Bank, has launched Bualuang Bharata Fund in
Thailand for institutional investors and high net worth investors.
Peaking into the past
From 2012 to 2018, NAM was among the second or third largest AMC in India
after HDFC AMC and ICICI Pru AMC. Due to default by erstwhile promoter
Reliance Capital coupled with scheme underperformance hampered their
market share from 11.5% in Mar 2015 to 7.6% in Mar 2020.
Post default, in Sep 2019, NAM took over as the sole promoter with 73.8% of
the outstanding shares and rebranded the company as ‘Nippon Life Asset
Management’. Market share has stabilized since then and bottomed out in Mar
2021 at 7.1%; since then, they have managed to improve overall market share
to 7.4% in Mar 2022 owing to improved fund performance, better risk
management, and further investment into the distribution network.
The main focus area for the management has been increasing the contribution
of retail investors in their overall mix and penetrating further into B-30 cities,
which has largely remained untapped by the mutual fund industry. Along with
this, they continue to focus on passive offering to remain a relevant player in
the passive management space. Management follows the ‘Investor First’
philosophy and would launch schemes to cater to investors’ varied and diverse
needs.
Nippon Life India Asset | Initiating Coverage Report
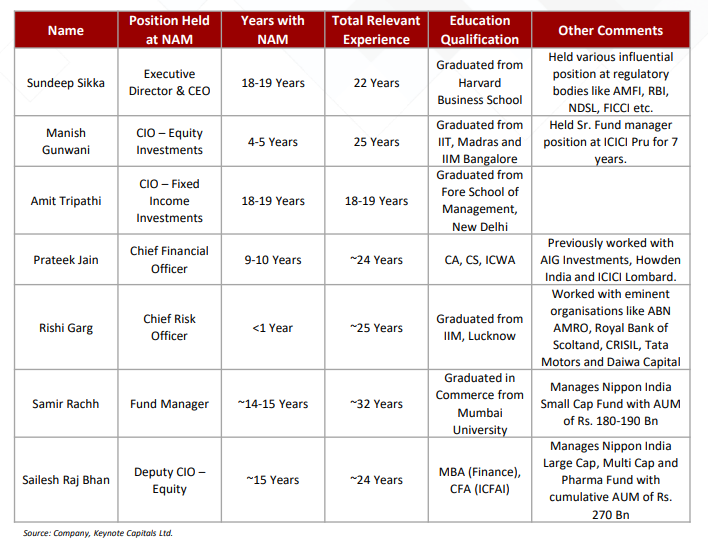
Board of Directors and Top Management
The company is currently headed by Mr. Sundeep Sikka, who has been with the
company since 2003 and CEO since 2009. Most of the company’s top
management has been with NAM for more than 10-15 years, and most have
more than 20 years of relevant industry experience.
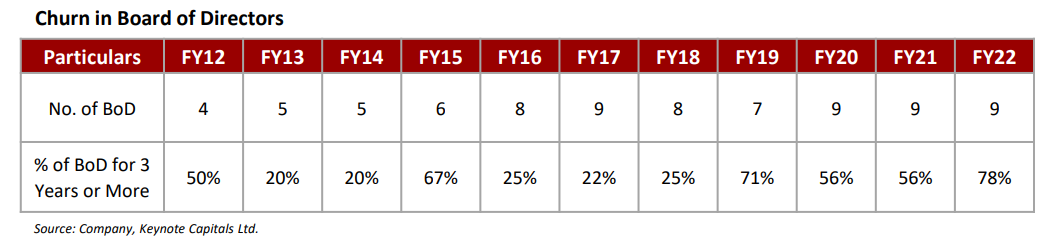
NAM has seen high churn in its Board of Directors in the initial years as less than
20-30% of the Board of Directors were with the company for three years or
more. But in the last few years, things have stabilized, and more than 50-70% of
the Board of Directors have been with the company for three years or more.
This is a very healthy sign.
Nippon Life India Asset | Initiating Coverage Report
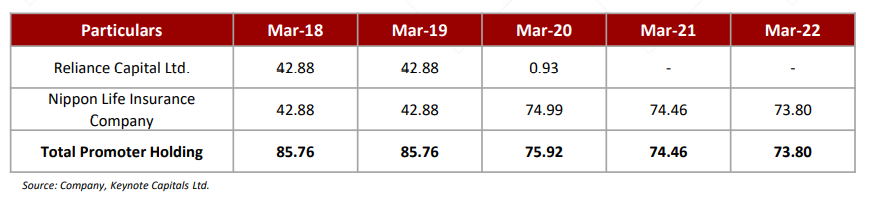
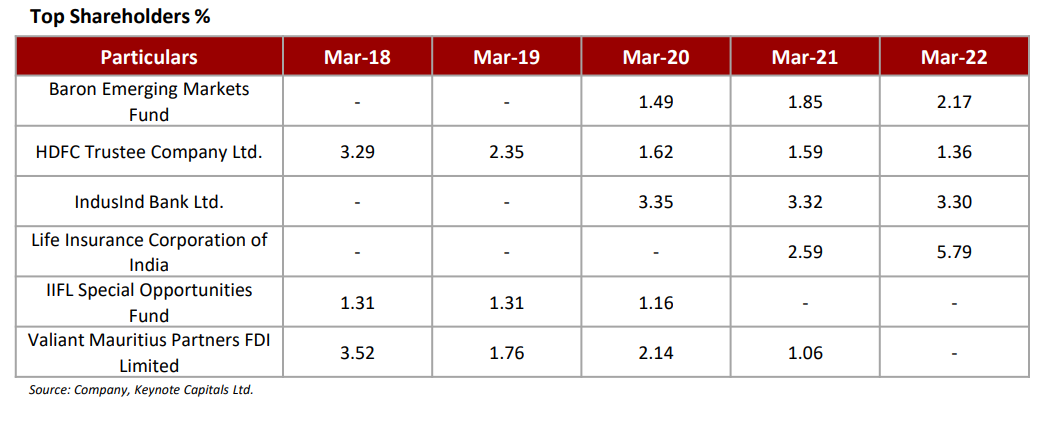
Skin in the game and Top Shareholders
The Company was incorporated as ‘Reliance Capital Asset Management’ in
Feb’1995. In 2012, Nippon Life made a strategic investment of 26% in Reliance
Capital Asset Management. Subsequently, Nippon Life holding was further
increased, and in 2015 company was renamed ‘Reliance Nippon Life Asset
Management Ltd.’ Eventually, the name was rechanged to ‘Reliance Nippon Life
Asset Management’ in May’2016. Post-IPO, both promoters held a 42.9% stake
in the Company. Later on, due to default by ADAG group, they sold their
holding to Nippon Life, making them the sole promoter of the Company.
Nippon Life rebranded the Company to ‘Nippon Life India Asset Management,’
and they own 73.8% of the Company.
Nippon Life India Asset | Initiating Coverage Report
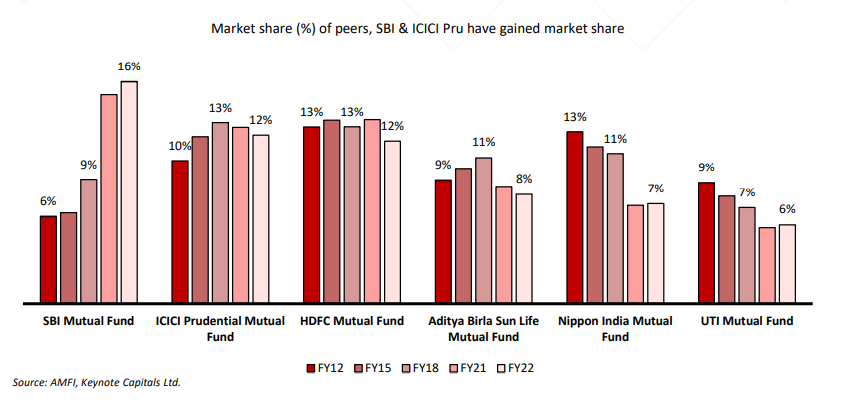
Where does NAM stand against its peers?
We have taken 6 AMCs (including NAM) for our analysis, representing 60-65%
of industry AUM.
SBI AMC has gained outstanding market share among our chosen peers in the
last decade across all asset classes (Equity/Debt/ETF and Liquid). All the other
AMCs have ceded market share in the last decade except SBI and ICICI Pru
AMC. HDFC AMC has lost significant market share in the equity segment due to
the poor performance of their schemes and the absence of few sector funds.
NAM has lost market share across all segments in the last decade.
Nippon Life India Asset | Initiating Coverage Report
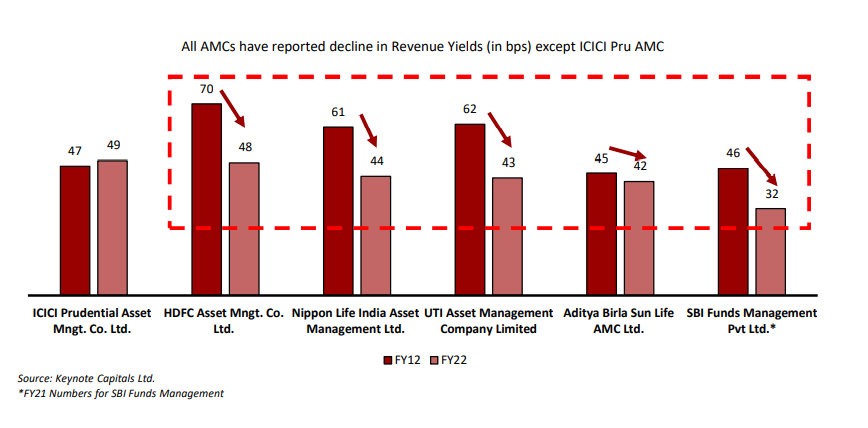
ICICI Pru AMC has the highest revenue yield among the chosen peers owning to
a high equity mix of ~50% (which are the highest yielding) and very minimal ETF
exposure at ~6% (which are the lowest yielding). ICICI Pru is the only AMC that
has managed to improve its yield in the last ten years. All other AMCs have seen
an erosion of yields. With a ban on upfront commission to distributors and the
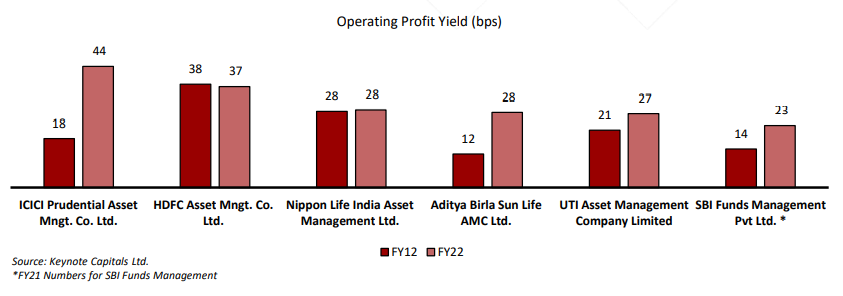
adoption of trailing commission, revenue yields have declined for AMCs.
However, expenses related to the schemes are expensed from the mutual fund
schemes and hence had a limited impact on operating profit yields. All AMCs
have managed to maintain their operating profit in last decade. Revenue yield
will continue to remain under pressure for all AMCs as old AUM (at high yields)
gets replaced with new AUM at lower yields, but due to significant operating
leverage in AMC business, the impact on profitability will be limited.
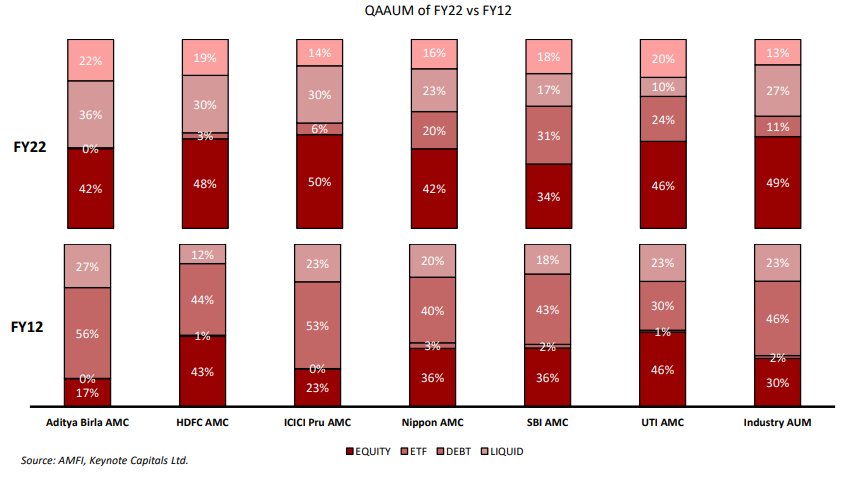
ETF contribution for SBI and UTI has increased owing to EPFO contribution. All
of these AMCs have shown improvement in equity mix in the last decade
except SBI and UTI AMC. Aditya Birla AMC & ICIC Pru AMC has significantly
improved the equity mix from 17% and 23% in March 2012 to 42% and 50%,
respectively.
Nippon Life India Asset | Initiating Coverage Report
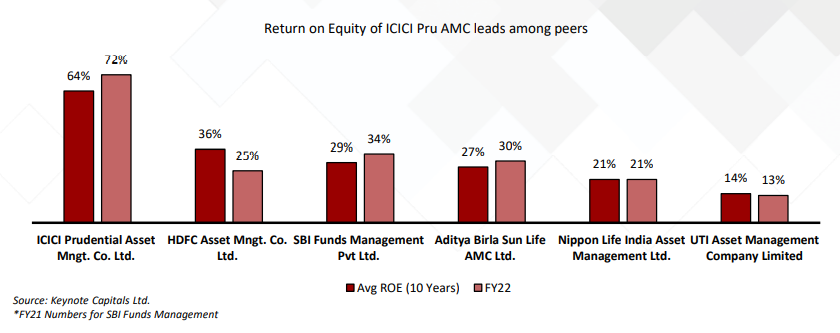
ICICI Pru has the highest ROE among its peers, owing to high operating profit
and revenue yield.
Ideal AUM mix for an AMC
According to our understanding, we believe for maximizing AUM yield for an
AMC; they need to meet all or most of the below criteria.
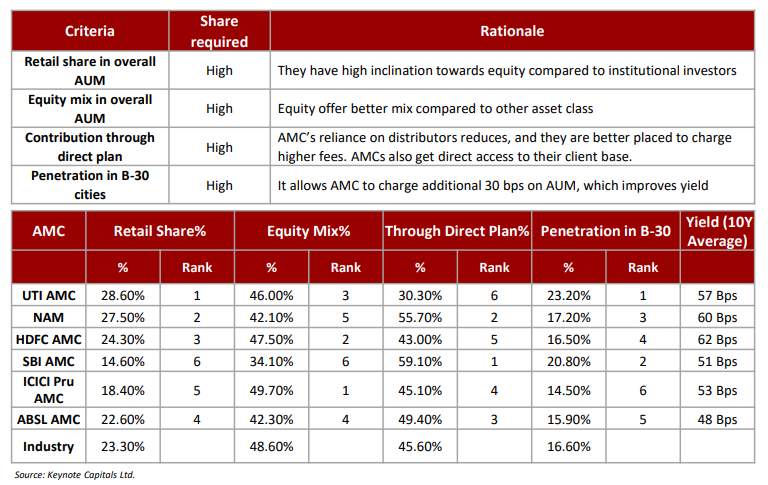
NAM has a higher share of retail investors (27.5%) compared to the industry
(23.3%), higher sourcing from direct channels (55.7%) vs. industry (45.6%), and
higher penetration in B-30 cities (17.2%) vs. industry (16.6%). All these are
yield-enhancing as it can be seen that NAM has the second highest ten-year
average yield after HDFCAMC.
Nippon Life India Asset | Initiating Coverage Report
Ranking of scheme performance in their respective category for Listed AMCs
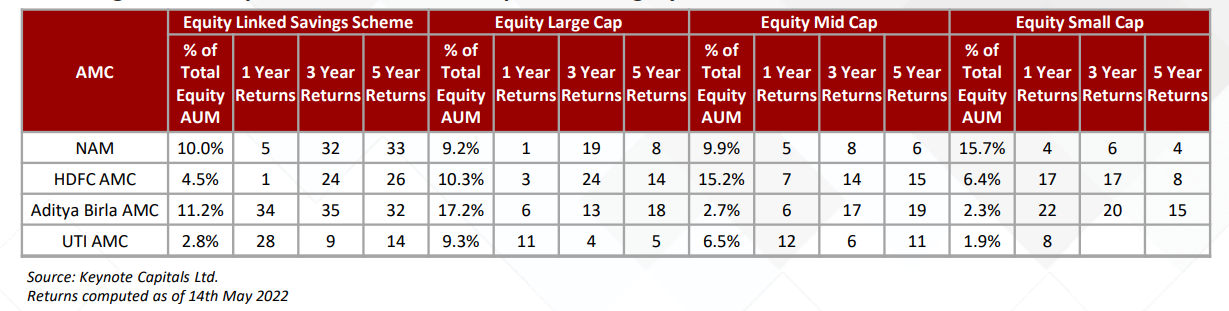
NAM and HDFC AMC have shown smart recovery in scheme performance. They
have managed to improve their ranking from 20/30+ rank in 3 & 5-year
performance to top performer in that category in last one year.
Generally, improvement in scheme performance is followed by market share
gain; hence, it bodes well for NAM and HDFC AMC, who have been losing
market share in the last few years due to scheme underperformance.
We believe scheme outperformance is essential to attract equity fund inflows,
especially from DIY retail investors who tend to give unequal weight to recent
scheme performance to zero down on a scheme.
An important thing to note is that NAM and HDFC AMC have outperformed
their peer group during a period when markets have been extremely volatile
and have not performed well.
Nippon Life India Asset | Initiating Coverage Report
Opportunities
Strong retail franchise
The share of retail investors in the AUM mix of NAM has increased from 13.6%
in FY14 to 27.5% in FY22. A similar number in the industry is 23.3%. Retail
investors tend to be more inclined towards equity products and are more sticky
than other investor classes. A rising share of retail investors bodes well for
AMC’s AUM yield. NAM has a higher market share in the retail segment at 8.7%
vs. 7.4% overall market share.
Leadership in passive products:
The company has one of the industry’s most extensive suites of passive
products with 25-30 ETF schemes and six index funds. NAM has almost 58% of
the industry’s folio market share in the passive category. Approx. NAM’s ETF
schemes contribute 68% of exchange ETF volumes. Among all the deciding
factors when choosing an ETF, having sufficient liquidity is of the essence;
otherwise, impact cost can be up to 2-3%. Hence, NAM is favorably placed in
the ETF market. NAM has a 13.5% market share of overall ETF AUM and one-third market share in the ETF space if we exclude SBI & UTI since their AUM is
skewed for EPFO contribution, access to which is not available to private players
like NAM. NAM’s ETF AUM has grown at a CAGR of 35.6% from Mar 2012 to
Mar 22.
Nippon Life India Asset | Initiating Coverage Report
The loss of market share is warranted since the company was among the few
AMCs to launch ETF products initially. Hence, they had a dominant market
share, but NAM’s market share eroded as other AMCs started expanding their
ETF offering. Market share also errored as major AUM is being contributed by
EPFO, which invests via SBI and UTI AMC’s ETF offering only. The magnitude of
the ETF offering by NAM is unmatched by its peers, placing them in a favorable
position.
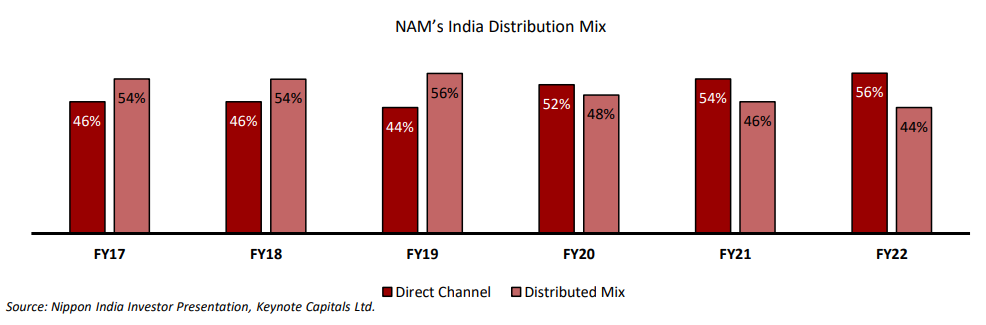
A high share of the direct channel in the distribution mix:
NAM has a distribution network of around 160 banks, 95 national distributors,
and ~84,100 mutual fund distributors. Of the overall AUM, 56% is sourced via
direct channel as of Mar’ 2022. It is favorable for the AMC since their reliance
on distributors reduces, and they are better placed to charge higher fees. To
further strengthen its direct channel reach, they have partnered with 20 digital
platforms such as Paytmmoney, Groww, ETMoney, etc. This will give them
access to a direct customer base and enable them to cross-sell their offerings.
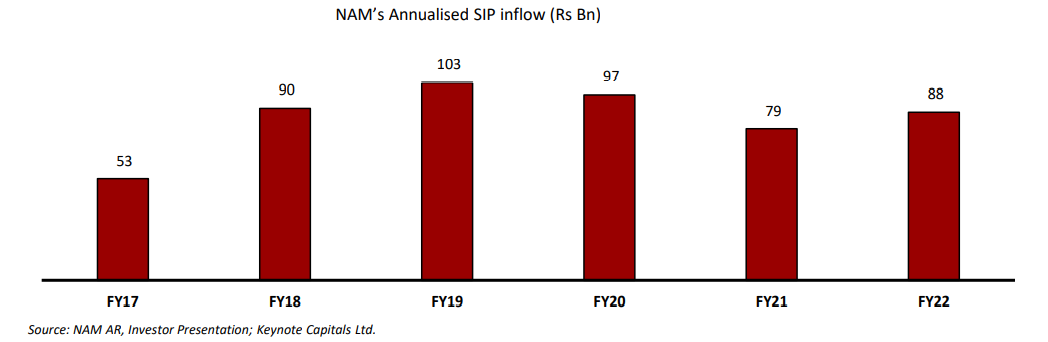
Strong SIP book with better stickiness than the industry
NAM has been focused on strengthening its penetration in B-30 cities via the
SIP route as it helps garner retail participation. SIP book of NAM has better
stickiness than the industry as SIP accounts continuing for more than five
years account for 48% of the AUM compared to 21% for the industry.
Since the default of the erstwhile promoter, SIP inflows have stabilized in
FY22. SIP inflow has increased from Rs. 53 Bn in FY17 to Rs. 88 Bn in FY22.
Given the improvement in scheme performance, we believe SIP flows will
improve strongly going forward.
Nippon Life India Asset | Initiating Coverage Report
Liquid category market share improved, equity category to follow
NAM has regained its lost market share in the liquid category in the Apr-Mar
22 period owing to better risk management practices followed by Nippon
Group, which has led to improved investor confidence. During FY22, liquid
AUM of NAM delivered a growth of 23.6% vs. negative -7.2% growth delivered
by industry.
Equity category market share has also stabilized in the last few quarters, and
recent improvement in scheme performance should be followed by market
share gain for them.
Nippon Life India Asset | Initiating Coverage Report
Challenges
Profitability vs market share, walking a tight rope
With increasing competitive intensity, AMCs face the dilemma of either
maintaining their market share or maintaining their profitability. With many
AMCs aggressively pricing their offerings, AMCs not matching up with the
industry pricing could lead to erosion of market share. NAM has been focused
on improving its profitability over market share. Hence, if pricing indiscipline
persists for a period greater than anticipated, the AUM growth of NAM could
be impacted.
Absence of strong captive banking channel and brand recall
Despite being a non-Bank AMC, Nippon has become the 6
th largest AMC inIndia. But NAM lacks captive banking channel access that all of the banking
AMC enjoy. Penetrating the untapped market of B-30 cities will need better
brand recall and an extensive distribution network, the benefit of which is
available to banking AMCs.
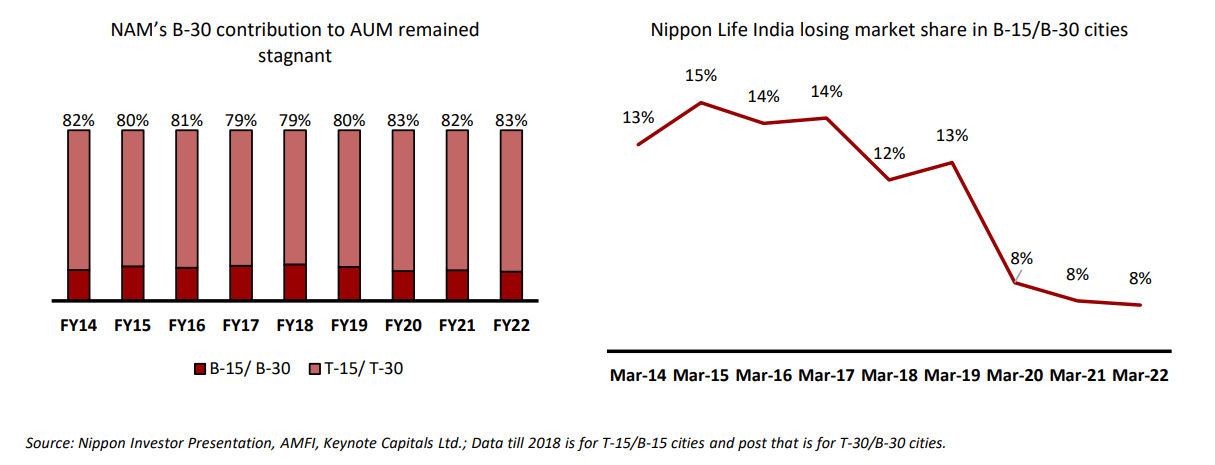
Losing market share in B-30 cities
AUM from B-30 cities provides the maximum yield to the AMCs as they tend to
have more inclination towards equities, and SEBI allows AMCs to charge a
further 30 bps. But in the last decade, the company’s AUM contribution from B-30 cities has remained stagnant and has been reducing since 2018 (around the
ADAG group default). They have been losing market share from B-30 cities,
which decreased to 7.7% in Mar 2022 compared to 12.1% in Mar 2018.
NAM’s AUM contribution (17.2%) from B-30 is higher than the industry’s
(16.6%). NAM’s market share from B-30 cities (7.7%) is better than T-30 cities
(7.3%) as of Mar-22.
Nippon Life India Asset | Initiating Coverage Report
Nippon Life India Asset | Initiating Coverage Report
Valuation & Estimates
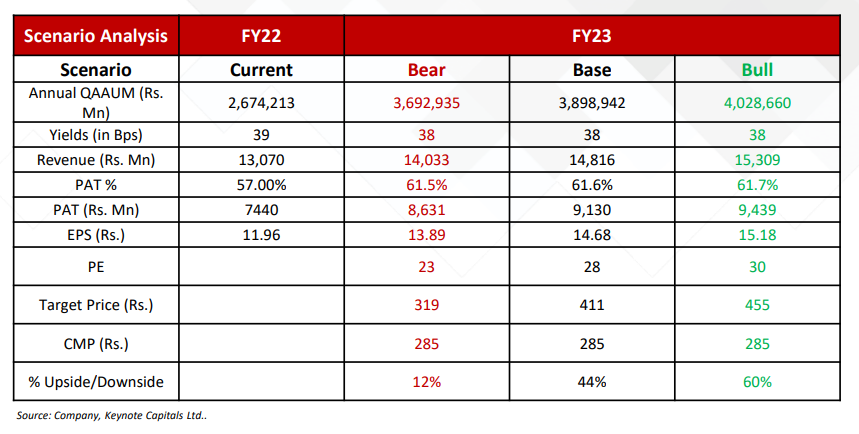
Base Case :
We have built an assumption of ~16.2% growth in AUM in FY23,
given that the company has managed to stabilize its market share and scheme
performance has improved in the last one year.
Given the ongoing yield pressure in the industry, we expect blended yields to
compress by ~1 bps in FY23. Most of this reduction is owing to increasing
competitive intensity in the industry, resulting in higher TER being passed on to
the distributors. In this case, trailing PE re-rates to ~28. Based on these
assumptions, we arrive at an upside of 44.2%.
Bear Case : We have built an assumption of 10% AUM growth in FY23, assuming
NAM continues to lose market share and grows at a pace lesser than the
industry. In which case PE of the company continues to trade at a -1 standard
deviation. We see an upside of 12% even in the Bear case scenario.
Bull Case : We have built an assumption of 20% AUM growth in FY23, assuming
NAM gains market share and grows at a pace higher than the industry. In that
case, we are assuming PE re-rates to around 30 (marginally below average
trailing PE of 33). Based on these assumptions, we arrive at an upside of 60%.
Nippon Life India Asset | Initiating Coverage Report
Valuations and Estimates

Peer Valuations
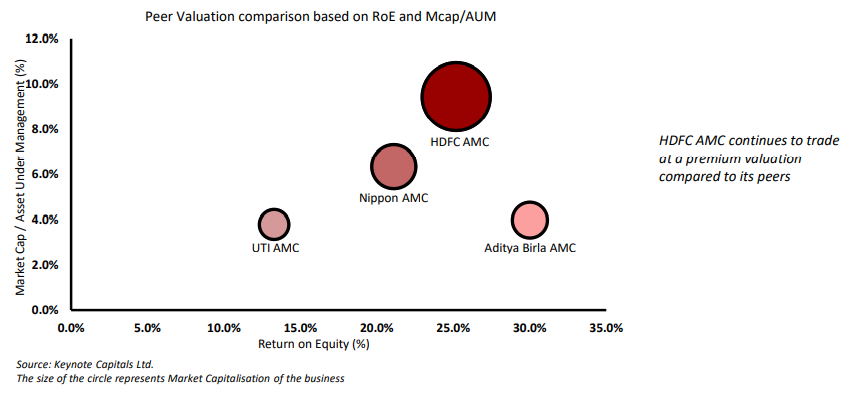
NAM trades at a premium valuation compared to Aditya Birla AMC owing to multiple
qualitative aspects like,
• NAM’s Leadership in the ETF category with almost one-third of market share by AUM
and 66% of traded volumes, whereas Aditya Birla has negligible presence in the ETF
space
• NAM’s management has guided more than 90-100% dividend payout in the future
compared to ~50% dividend payout guidance given by Aditya Birla AMC.
• NAM has strong parentage with a global presence in Insurance and Asset
Management. In contrast, Aditya Birla Group is a diversified conglomerate, with Asset
Management being a small part of the group’s business.
Nippon Life India Asset | Initiating Coverage Report
Rating Methodology
| Rating | Criteria |
|---|---|
| BUY | Expected positive return of > 10% over 1-year horizon |
| Neutral | Expected positive return of > 0% to < 10% over 1-year horizon |
| REDUCE | Expected return of < 0% to -10% over 1-year horizon |
| SELL | Expected to fall by >10% over 1-year horizon |
| NOT RATED (NR)/UNDER REVIEW (UR)/COVERAGE SUSPENDED (CS) | Not covered by Keynote Capitals Ltd/Rating & Fair value under Review/Keynote Capitals Ltd has suspended coverage |
Disclosures and Disclaimers
The following Disclosures are being made in compliance with the SEBI Research Analyst
Regulations 2014 (herein after
referred to as the
Regulations).
Keynote Capitals Ltd. (KCL) is a SEBI Registered Research Analyst having registration no.
INH000007997. KCL, the
Research Entity (RE) as defined in
the Regulations, is engaged in the business of providing Stock broking services, Depository participant
services &
distribution of various financial
products. Details of associate entities of Keynote Capitals Limited are available on the website at https://www.keynotecapitals.com/associate-entities/
KCL and its associate company(ies), their directors and Research Analyst and their relatives
may; (a) from time to time,
have a long or short position
in, act as principal in, and buy or sell the securities or derivatives thereof of companies mentioned
herein. (b) be
engaged in any other transaction
involving such securities and earn brokerage or other compensation or act as a market maker in the financial
instruments
of the company(ies)
discussed herein or act as an advisor or lender/borrower to such company(ies) or may have any other
potential conflict
of interests with respect to
any recommendation and other related information and opinions.; however the same shall have no bearing
whatsoever on the
specific
recommendations made by the analyst(s), as the recommendations made by the analyst(s) are completely
independent of the
views of the
associates of KCL even though there might exist an inherent conflict of interest in some of the stocks
mentioned in the
research report.
KCL and / or its affiliates do and seek to do business including investment banking with
companies covered in its
research reports. As a result, the
recipients of this report should be aware that KCL may have a potential conflict of interest that may affect
the
objectivity of this report.
Compensation of Research Analysts is not based on any specific merchant banking, investment banking or
brokerage service
transactions.
Details of pending Enquiry Proceedings of KCL are available on the website at https://www.keynotecapitals.com/pending-enquiry-proceedings/
A graph of daily closing prices of securities is available at www.nseindia.com,
www.bseindia.com. Research Analyst views
on Subject Company may
vary based on Fundamental research and Technical Research. Proprietary trading desk of KCL or its associates
maintains
arm’s length distance with
Research Team as all the activities are segregated from KCL research activity and therefore it can have an
independent
view with regards to Subject
Company for which Research Team have expressed their views.
Regional Disclosures (outside India)
This report is not directed or intended for distribution to or use by any person or entity
resident in a state, country
or any jurisdiction, where such
distribution, publication, availability or use would be contrary to law, regulation or which would subject
KCL & its
group companies to registration or
licensing requirements within such jurisdictions. The securities described herein may or may not be eligible
for sale in
all jurisdictions or to certain
category of investors. Persons in whose possession this document may come are required to inform themselves
of and to
observe such restriction.
Specific Disclosure of Interest statement for subjected Scrip in this document:
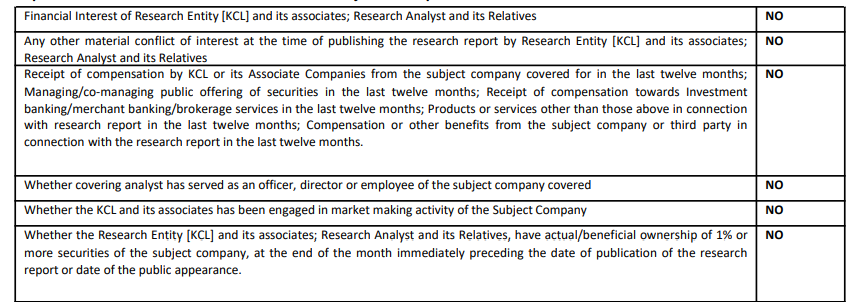
Nippon Life India Asset | Initiating Coverage Report
The associates of KCL may have:
-financial interest in the subject company
-actual/beneficial ownership of 1% or more
securities in the subject company
-received compensation/other benefits from the subject company in the
past 12 months
-other potential conflict of interests with respect to any recommendation and other
related information and opinions.;
however, the same shall
have no bearing whatsoever on the specific recommendations made by the analyst(s), as the recommendations
made by the
analyst(s) are
completely independent of the views of the associates of KCL even though there might exist an inherent
conflict of
interest in some of the stocks
mentioned in the research report.
-acted as a manager or co-manager of public offering of securities of
the subject company in past 12 months
-be engaged in any other transaction involving such securities and
earn brokerage or other compensation or act as a
market maker in the financial
instruments of the company(ies) discussed herein or act as an advisor or lender/borrower to such
company(ies)
-received compensation from the subject company in the past 12 months for investment
banking / merchant banking /
brokerage services or from
other than said services
The associates of KCL has not received any compensation or other benefits from third party in
connection with the
research report.
Above disclosures includes beneficial holdings lying in demat account of KCL which are opened
for proprietary
investments only. While calculating
beneficial holdings, it does not consider demat accounts which are opened in name of KCL for other purposes
(i.e.
holding client securities,
collaterals, error trades etc.). KCL also earns DP income from clients which are not considered in above
disclosures.
Analyst Certification
The views expressed in this research report accurately reflect the personal views of the
analyst(s) about the subject
securities or issues, and no part
of the compensation of the research analyst(s) was, is, or will be directly or indirectly related to the
specific
recommendations and views expressed
by research analyst(s) in this report.
Terms & Conditions:
This report has been prepared by KCL and is meant for sole use by the recipient and not for
circulation. The report and
information contained herein
is strictly confidential and may not be altered in any way, transmitted to, copied or distributed, in part
or in whole,
to any other person or to the
media or reproduced in any form, without prior written consent of KCL. The report is based on the facts,
figures and
information that are believed to
be true, correct, reliable and accurate. The intent of this report is not recommendatory in nature. The
information is
obtained from publicly
available media or other sources believed to be reliable. Such information has not been independently
verified and no
guaranty, representation of
warranty, express or implied, is made as to its accuracy, completeness or correctness. All such information
and opinions
are subject to change
without notice. The report is prepared solely for informational purpose and does not constitute an offer
document or
solicitation of offer to buy or
sell or subscribe for securities or other financial instruments for the clients. Though disseminated to all
the
customers simultaneously, not all
customers may receive this report at the same time. KCL will not treat recipients as customers by virtue of
their
receiving this report
Disclaimer:
The report and information contained herein is strictly confidential and meant solely for the
selected recipient and may
not be altered in any way,
transmitted to, copied or distributed, in part or in whole, to any other person or to the media or
reproduced in any
form, without prior written
consent. This report and information herein is solely for informational purpose and may not be used or
considered as an
offer document or
solicitation of offer to buy or sell or subscribe for securities or other financial instruments. Nothing in
this report
constitutes investment, legal,
accounting and tax advice or a representation that any investment or strategy is suitable or appropriate to
your
specific circumstances. The
securities discussed and opinions expressed in this report may not be suitable for all investors, who must
make their
own investment decisions,
based on their own investment objectives, financial positions and needs of specific recipient. This may not
be taken in
substitution for the exercise
of independent judgment by any recipient. Each recipient of this document should make such investigations as
it deems
necessary to arrive at an
independent evaluation of an investment in the securities of companies referred to in this document
(including the
merits and risks involved), and
should consult its own advisors to determine the merits and risks of such an investment. The investment
discussed or
views expressed may not be
suitable for all investors. Certain transactions -including those involving futures, options, another
derivative product
as well as non-investment
grade securities – involve substantial risk and are not suitable for all investors. No representation or
warranty,
express or implied, is made as to the
accuracy, completeness or fairness of the information and opinions contained in this document. The
Disclosures of
Interest Statement
incorporated in this document is provided solely to enhance the transparency and should not be treated as
endorsement of
the views expressed
in the report. This information is subject to change without any prior notice. The Company reserves the
right to make
modifications and
alternations to this statement as may be required from time to time without any prior approval. KCL, its
associates,
their directors and the
employees may from time to time, effect or have affected an own account transaction in, or deal as principal
or agent in
or for the securities
mentioned in this document. KCL, its associates, their directors and the employees may from time to time
invest in any
discretionary PMS/AIF
Fund and those respective PMS/AIF Funds may affect or have effected any transaction in for the securities
mentioned in
this document. They may
perform or seek to perform investment banking or other services for, or solicit investment banking or other
business
from, any company referred
to in this report. Each of these entities functions as a separate, distinct and independent of each other.
The recipient
should take this into account
before interpreting the document. This report has been prepared on the basis of information that is already
available in
publicly accessible media
or developed through analysis of KCL. The views expressed are those of the analyst, and the Company may or
may not
subscribe to all the views
expressed therein. This document is being supplied to you solely for your information and may not be
reproduced,
redistributed or passed on,
directly or indirectly, to any other person or published, copied, in whole or in part, for any purpose. This
report is
not directed or intended for
distribution to, or use by, any person or entity who is a citizen or resident of or located in any locality,
state,
country or other jurisdiction, where
such distribution, publication, availability or use would be contrary to law, regulation or which would
subject KCL to
any registration or licensing
requirement within such jurisdiction.
Nippon Life India Asset | Initiating Coverage Report
The securities described herein may or may not be eligible for sale in all jurisdictions or to
certain category of
investors. Persons in whose possession
this document may come are required to inform themselves of and to observe such restriction. Neither the
Firm, not its
directors, employees, agents
or representatives shall be liable for any damages whether direct or indirect, incidental, special or
consequential
including lost revenue or lost
profits that may arise from or in connection with the use of the information. The person accessing this
information
specifically agrees to exempt KCL
or any of its affiliates or employees from, any and all responsibility/liability arising from such misuse
and agrees not
to hold KCL or any of its affiliates
or employees responsible for any such misuse and further agrees to hold KCL or any of its affiliates or
employees free
and harmless from all losses,
costs, damages, expenses that may be suffered by the person accessing this information due to any errors and
delays.
Keynote Capitals Limited (CIN: U67120MH1995PLC088172)
Compliance Officer: Mr. Jairaj Nair; Tel: 022-68266000; email id: jairaj@keynoteindia.net
Registered Office: 9th Floor, The Ruby, Senapati Bapat Marg, Dadar West, Mumbai – 400028,
Maharashtra. Tel: 022 –
68266000.
SEBI Regn. Nos.: BSE / NSE (CASH / F&O / CD): INZ000241530; DP: CDSL- IN-DP-238-2016; Research
Analyst: INH000007997
For any complaints email at kcl@keynoteindia.net
General Disclaimer: Client should read the Risk Disclosure Document issued by SEBI & relevant
exchanges and the T&C on www.keynotecapitals.com; Investment in
securities market are subject to market risks, read all the related documents
carefully before investing.